


私のサーバーはdebian Wheezyとhtop 1.0.1で実行されていますが、ダッシュボードにはCPUの100.0%の値を除いて何も表示されません。
メーター値を常に表示できますか?
これは私のサーバーの現在のhtopマークです。

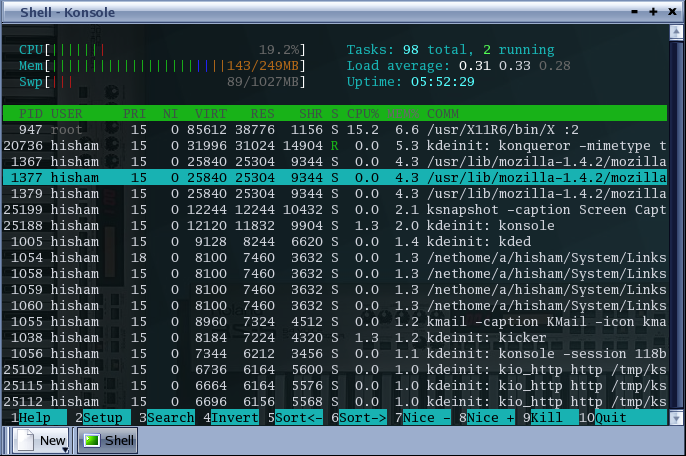
しかし、下のスクリーンショットのように、メーターに数字が常に表示されるようにしたいです。https://hisham.hm/htop/index.php?page=screenshots:
私のhtoprcは〜/.config/htop/htoprcにあり、次のデータが含まれています。
# The parser is also very primitive, and not human-friendly.
fields=0 48 17 18 38 39 40 2 46 47 49 1
sort_key=46
sort_direction=1
hide_threads=0
hide_kernel_threads=1
hide_userland_threads=0
shadow_other_users=0
show_thread_names=0
highlight_base_name=1
highlight_megabytes=1
highlight_threads=0
tree_view=0
header_margin=1
detailed_cpu_time=0
cpu_count_from_zero=0
color_scheme=0
delay=15
left_meters=LeftCPUs2 CPU Memory Swap
left_meter_modes=1 1 1 1
right_meters=RightCPUs2 Tasks LoadAverage Uptime
right_meter_modes=1 2 2 2
答え1
私にとって問題は、端末ではなく、~/.config/htop/htoprc端末のカラースキームです。
htopのデフォルトカラーモードを使用してKonsoleでOne Darkテーマを使用すると、この問題が発生しました。
2つの解決策があります。
- 端末のカラースキームの変更
- htopカラースキームの変更:
F2 → Colors → [x] Something different that you like!
変えたらもう数字が見えますね。
答え2
まあ、あなたはhtoprcファイルを作成します。私のファイルは〜/config/htop/htoprcにあります。 Ubuntuでどのように機能するのかわかりませんが、それも機能します。
内部には次のように入力します。
left_meters=AllCPUs Memory Swap
left_meter_modes=1 1 1
すると、希望する結果が出ます。
color_scheme 番号を変更することもできます。おそらく、背景は数字と同じ色であるかもしれません。